

Assets
Story board content often needs to include content that is NOT derived from Data Discovery reports and queries. These items are called "Assets".
There are 2 main types of assets: Image assets imported into the application and General assets that pre-exist in the application.
- Imported image assets can be made private (for use by the user only) or public (shared across all users with role access to the asset). Image assets can also be turned into dynamic graphics that are data driven ("infographics").
- General assets can be saved as "templates" that can also be made public or private. Included in general assets is a stock image library that is installed with the application.
Once added, assets can be found in the Asset Tree - which provides a convenient drag-and-drop list of available assets that can be placed on the slide canvas. All assets can be placed on to the canvas and manipulated on screen (see manipulation) to change not only their size, shape and orientation; but in some cases their content.
NOTE: Only Professional users can add public assets.
Image Assets
Image Assets can be imported using the image loader and come in 2 varieties:
- Raster (PNG, JPG) images
- Vector (SVG or XAML) images.
Raster Image Assets
When a user needs to display a bitmap image (either "png" or "jpg") they can use the Asset import wizard to add image files into the dashboard.
Vector Image Assets
To use a vector image to display, a user can import a vector into the system. SVG and XAML images can be derived from most vector graphic utilities and are described in XML text. Vector imaging offers users the ability to add images into the application that can be scaled and manipulated without any pixelation.
Infographics
To make a dynamic image that changes its color, size, rotation and text values, users can use the infographic or "dynamic image" features. See here for more.
General Assets
General Assets come in several varieties:
- Web Panels - for embedding web sites or other web application content;
- Buttons - for launching URL's or running JavaScript logic;
- Text Panels - for headers, date, time and plain text.
- Stock Images - a collection of preloaded vector images
Web Panels
Web panels are used when a user needs to show 3rd party content hosted in a web page. Web panels are able to "host" other content side by side with the analytics in the Story Board providing a convenient method for showing non-analytic content. Importantly, web panels and analytic content can be meshed together using interactions to create symbiotic dashboards that cut across all types of content.
Button Assets
Buttons are used when a user needs to create a "macro" function. Buttons can be used to launch a pop-up page with a given URL address or used to run JavaScript code. This can be very useful when offering users the ability to launch 3rd party application from the dashboard. Importantly, buttons and analytic content can be meshed together using interactions providing a mechanism for dashboard designers to deliver intelligent buttons based on a user's interactive use of the dashboard.
Clear Buttons
Buttons can have their backgrounds turned to transparent. This will allow them to 'float' over visible content and provide a 'click' mechanism for better guided analytics where needed.
Text Panels
Text panels are used to display text on the dashboard slide. Text panels come in 4 varieties: headers, time and date which are specific to their function; and generic text for free form text. Importantly, text and analytic content can be meshed together using interactions providing a mechanism for displaying key facts and figures on a dashboard based on a user's interactive use of the dashboard.
Processed Dates
Users can add in a new asset to show the Last Processed Date of a data model. You select Processed Date from the menu and drag and drop it into the slide. A dialog box appears when you right-click on the asset and select "Edit".
Then, you can insert text to describe the selected data model - choose the model from the bottom section. The [D] is a placeholder for the selected data model, its information will automatically appear in the slide. You can format the date by using the Date Format drop-down menu and even customize your own format by choosing the "Custom" option.
NOTE: The created Processed Date will only be available in the current slide.
Stock Images
This is a folder of preloaded vector images installed with the application. They have been optimized for use in dynamic images and infographics.
Managing Assets
Adding Assets
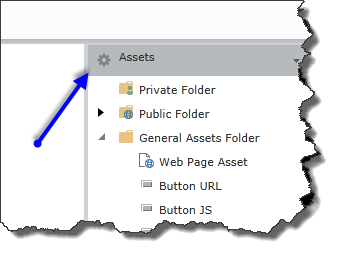
Image Assets can be added by either clicking the "Assets" button on the home tab in the Story Board designer or using the Asset quick menu in the Asset Tree panel (blue arrow below).
NOTE: General Assets cannot be added. Instead, users simply drag them off the asset tree panel onto the slide canvas .
For images, users are presented with the Asset wizard.
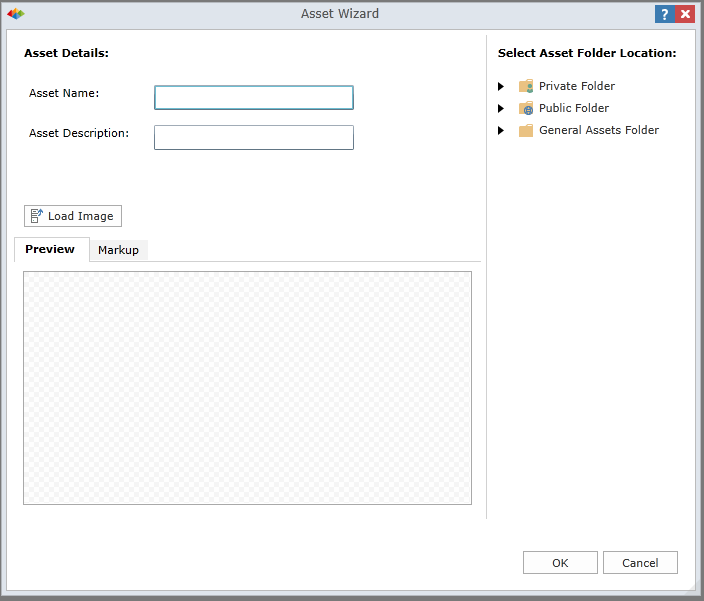
- Provide an asset name and a metadata description
- Indicate whether the asset is private or public by picking it folder location on the right
- Click the Load Image button to find the file to upload (see more on the image imported process here):
- Raster Images: choose either PNG or JPG files.
- Vector Images: choose either SVG or XAML files.
- The preview is presented below.
- Click OK.
Editing and Removing Assets
Assets can be edited and deleted by using the context menu's in the Asset Tree using the DELETE key on your keyboard.
Asset Templates
All general assets can be saved as templates for future use. "Templating" provides a convenient short-cut to configuring general assets for other slides across dashboards.
Manipulating Assets
Assets can be manipulated on the canvas in various ways depending on the type of asset. See Asset Manipulation for more.
Home |
Table of Contents |
Index |
User Community
Pyramid Analytics © 2011-2022